Last updated · 14 May 2024
Team satisfaction reports
Transparency is something we strongly believe in and commit to. Sometimes, this is easier said than done, especially when it's not all going so swimmingly. Sometimes, it will resemble a straight-out-of-bed look, unlike the polished Case Studies we usually share (do go check them out, though).
By being transparent, we are holding ourselves accountable and demonstrating our commitment to continuously strive for excellence, as per point 1 in our Playbook: “Excellence shall always be our driving factor.“
We carry out bi-annual engagement surveys to measure our team's happiness, engagement, teamwork, and career, amongst other key metrics. A 6-month gap between surveys allows us to make changes and put real actions in place before reassessing where we are at. In other words, each questionnaire measures the effectiveness of the measures put in place six months before.
As a side note, we had weekly surveys before moving to a monthly cadence, and before settling at the 6-month turnaround. We noticed that such frequency led to huge participation drops, which made the data unusable for statistical purposes. On top of that, such a short period didn't allow us to effectively put changes into place before issuing the next set of inquiries. Moreover, it is normal for a team to have spikes in happiness and frustration over time. With such a short turnover, each survey was bound to reflect the impulsive feelings of the week prior, which was not what we wanted to measure.
The Surveys.
Before getting into the nitty-gritty of the data itself, we should state that we use Culture Amp as our employee engagement measurement tool. The reports we share here are fully third-party. None of the math or the logic of it has been put together or manipulated by Significa.
We should also note that none of the five partners of Significa ever answered any of these surveys. The participants are non-board member employees only. Furthermore, engagement surveys are only completed by those who have already completed six months of tenure at Significa.
Engagement.
As you review the reports, you'll notice an emphasis on the “Engagement” score. It's the key score we always want to push up higher and higher.
Here's how Culture Amp defines it:
The engagement score measures people's connection and commitment to the company and its goals. By lifting it, we can impact performance, innovation and talent attraction and retention.
Here you go. Please feel free to have a look for yourself.
From here, we will present the key results of every survey ever completed at CultureAmp.
November 2023.
We wrote a blog post about our interpretation of these results from June to November and which actions we put in place to drive them. You can check that out here: How we increased employee engagement at Significa.
Full reports.
EoY ‘23: Engagement Survey Overview.pdf EoY ‘23 Survey: Every question.pdfEngagement score.
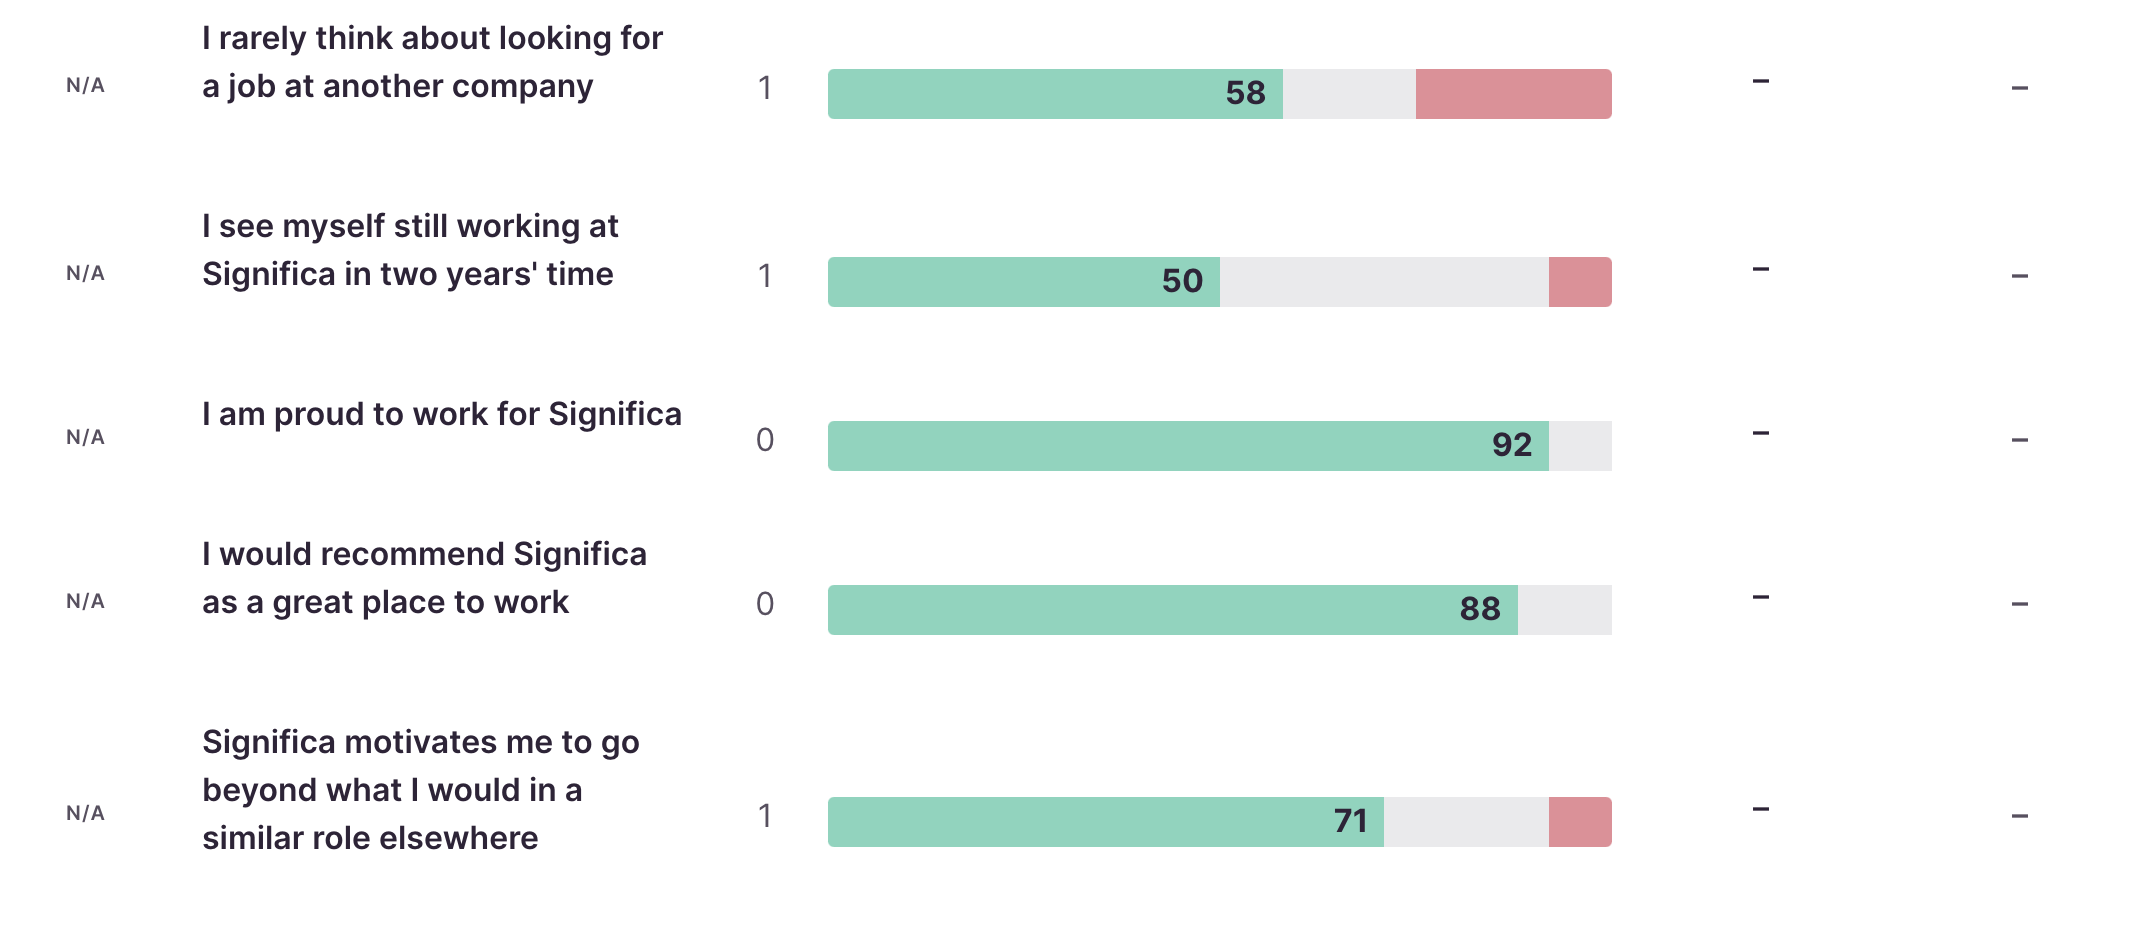
The combination of a series of questions is brought together to determine the engagement score.
Heavier questions.
The questions that pose a higher impact on the Engagement score.
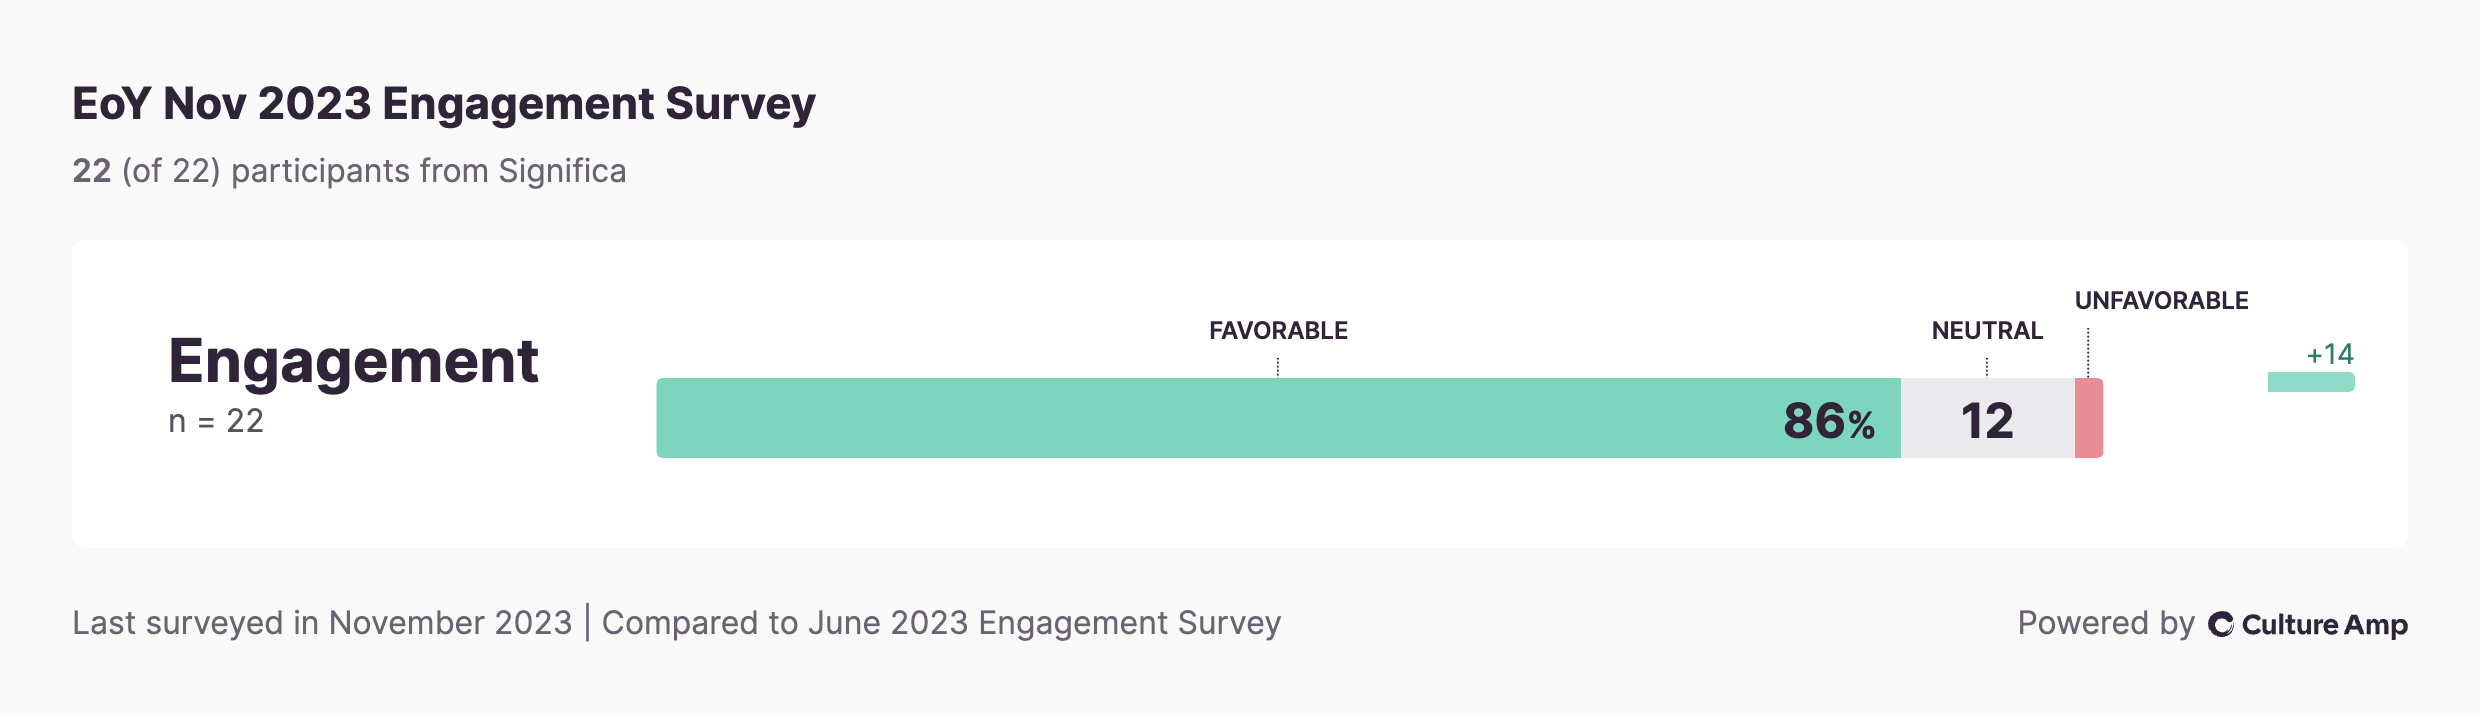
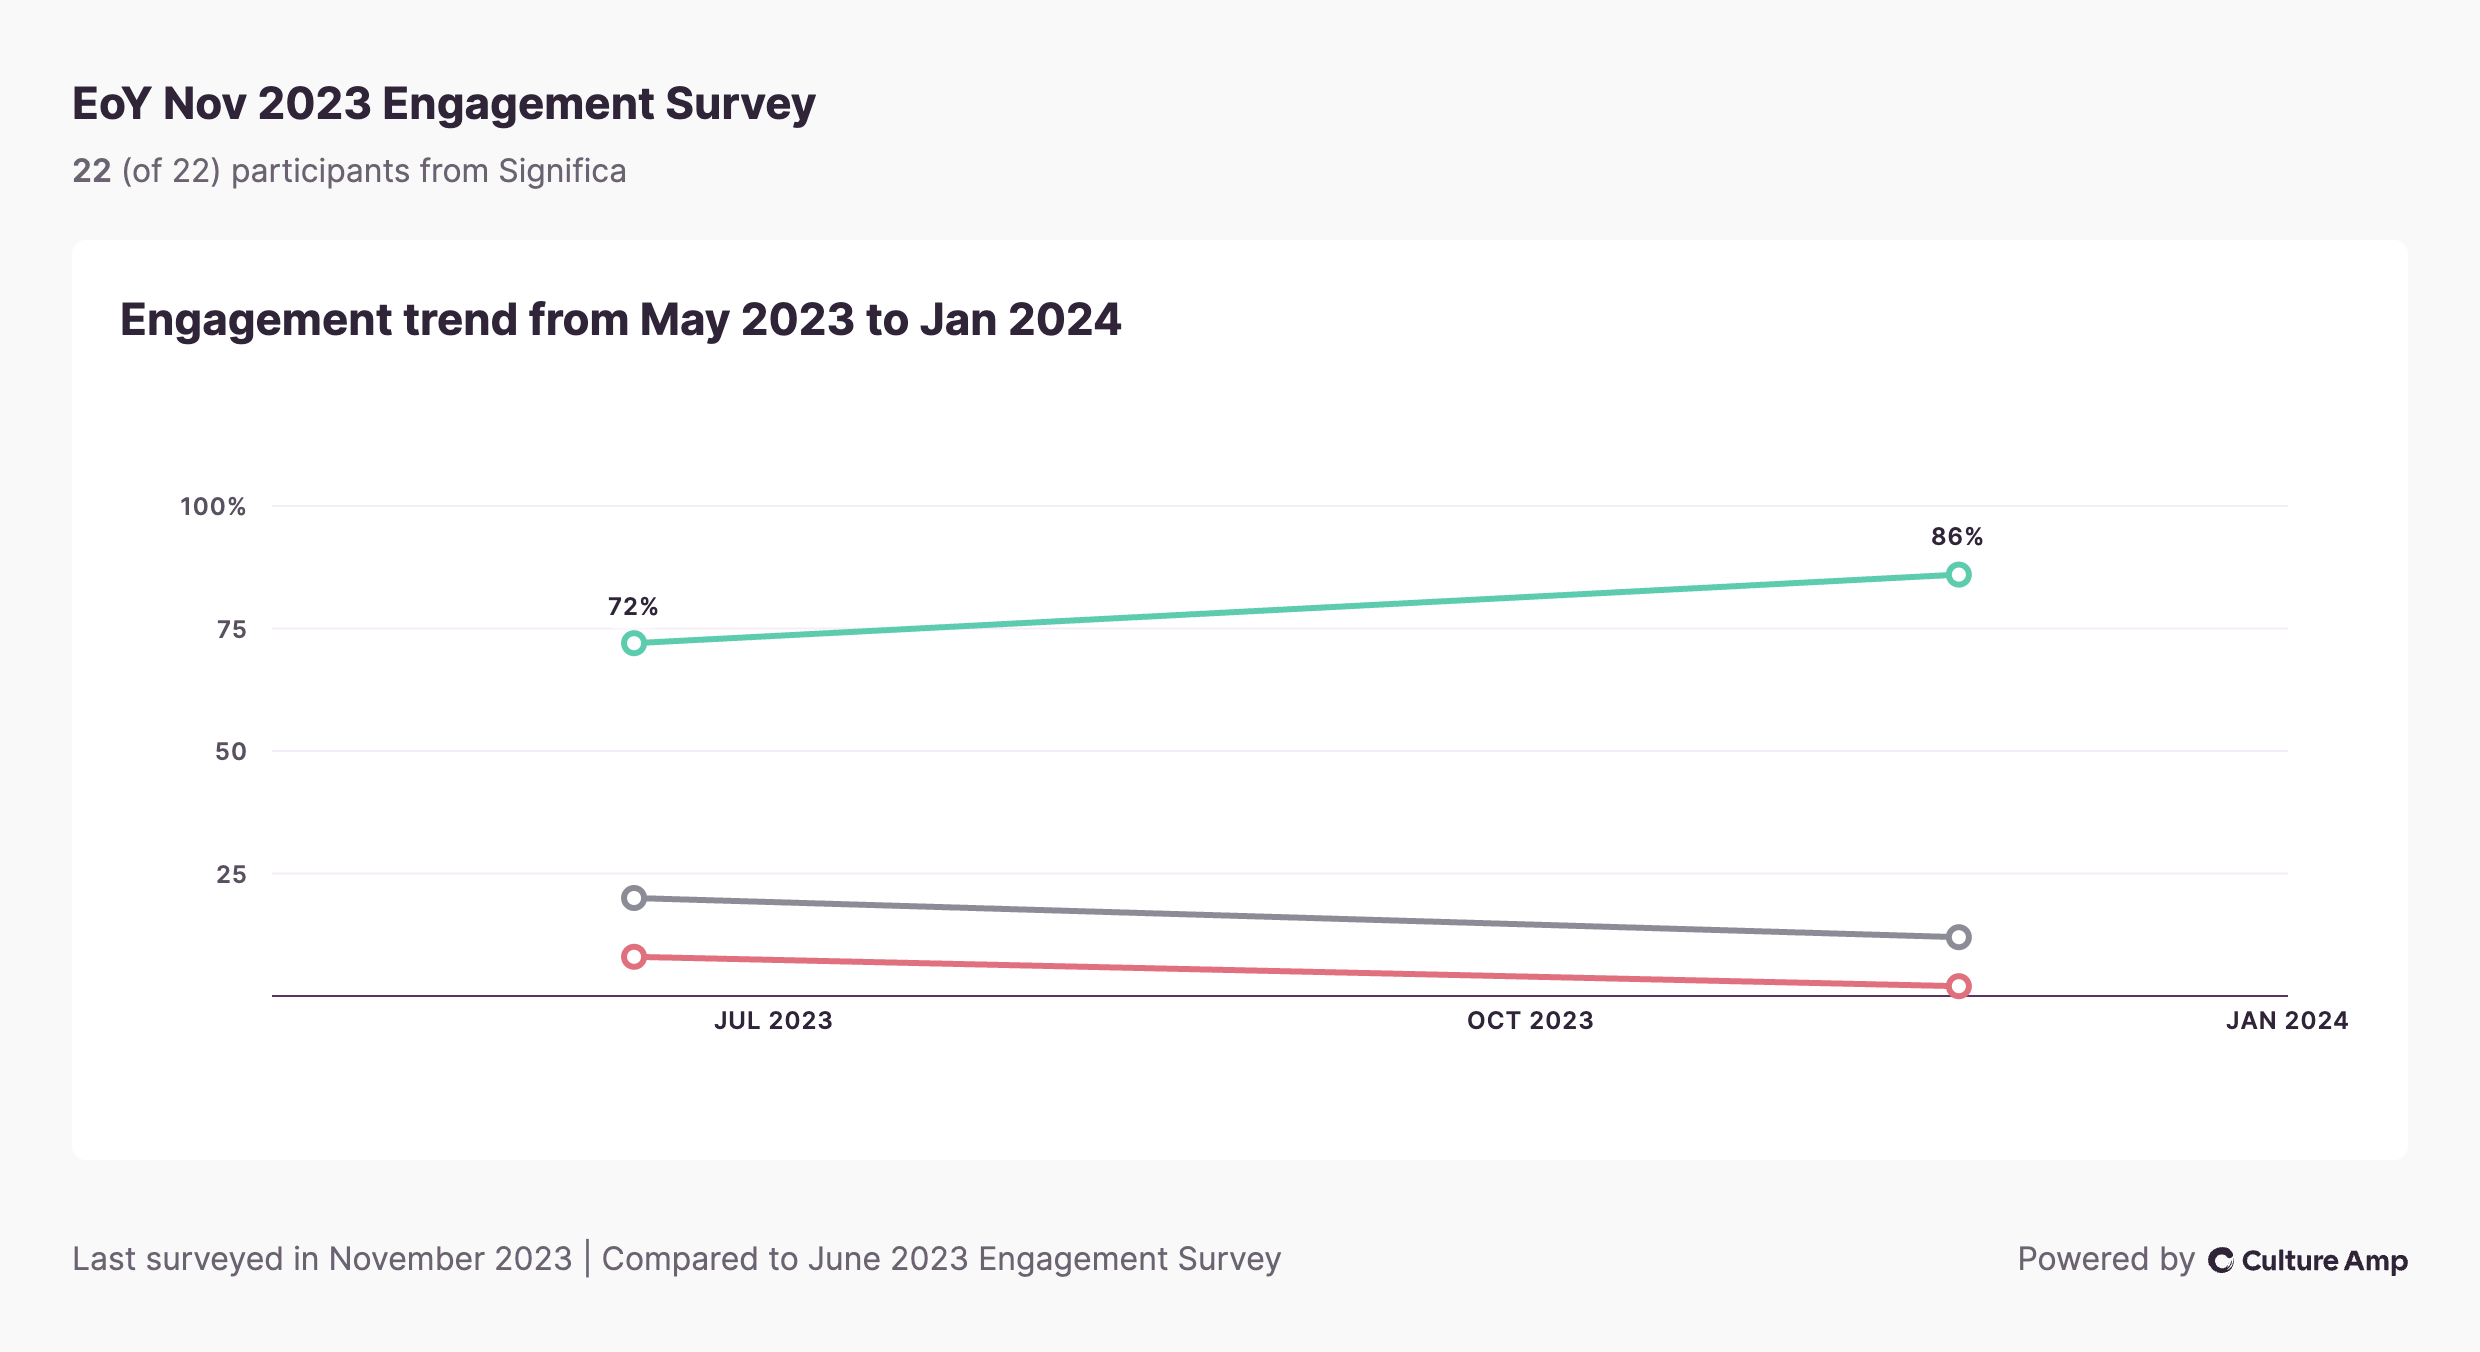
Engagement trend.
Since our survey in June 2023, the engagement score has seen a rise of 14%, from 72% to 86% in our November survey. Unfavourable and neutral scores dropped as engagement rose.
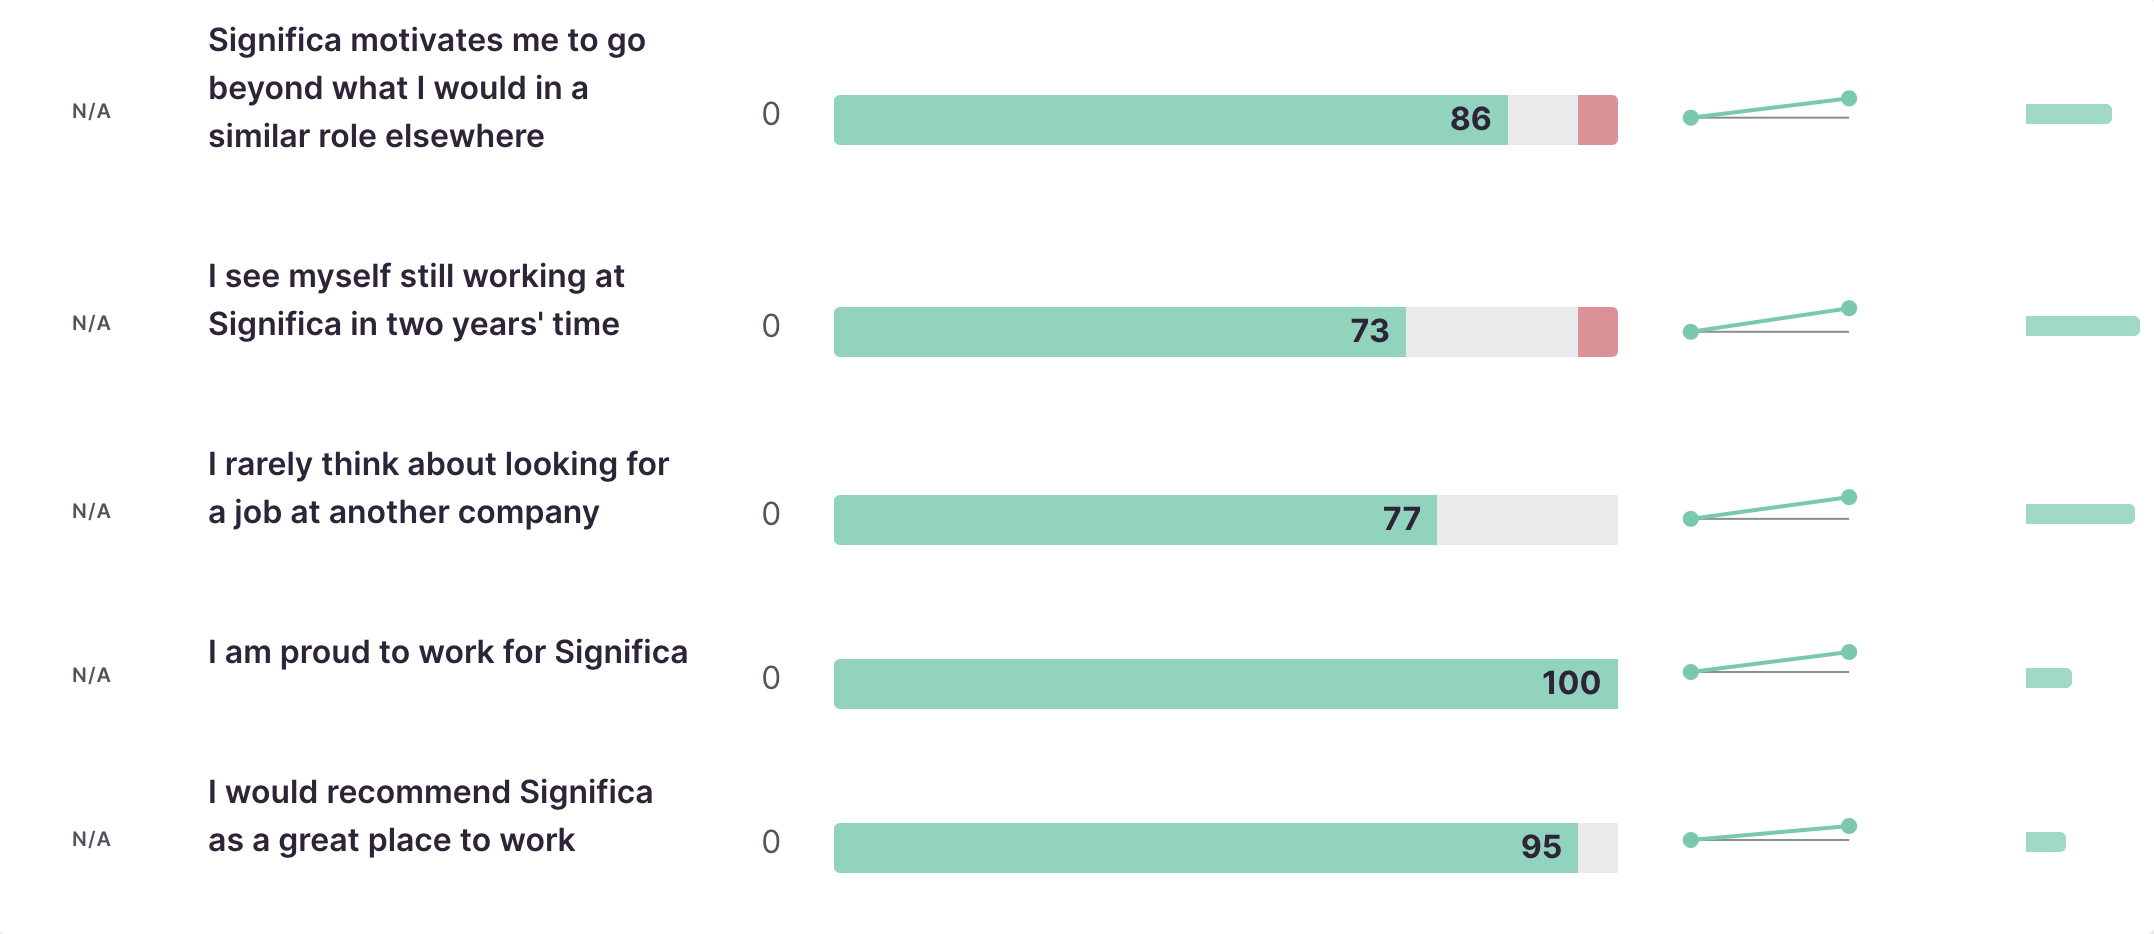
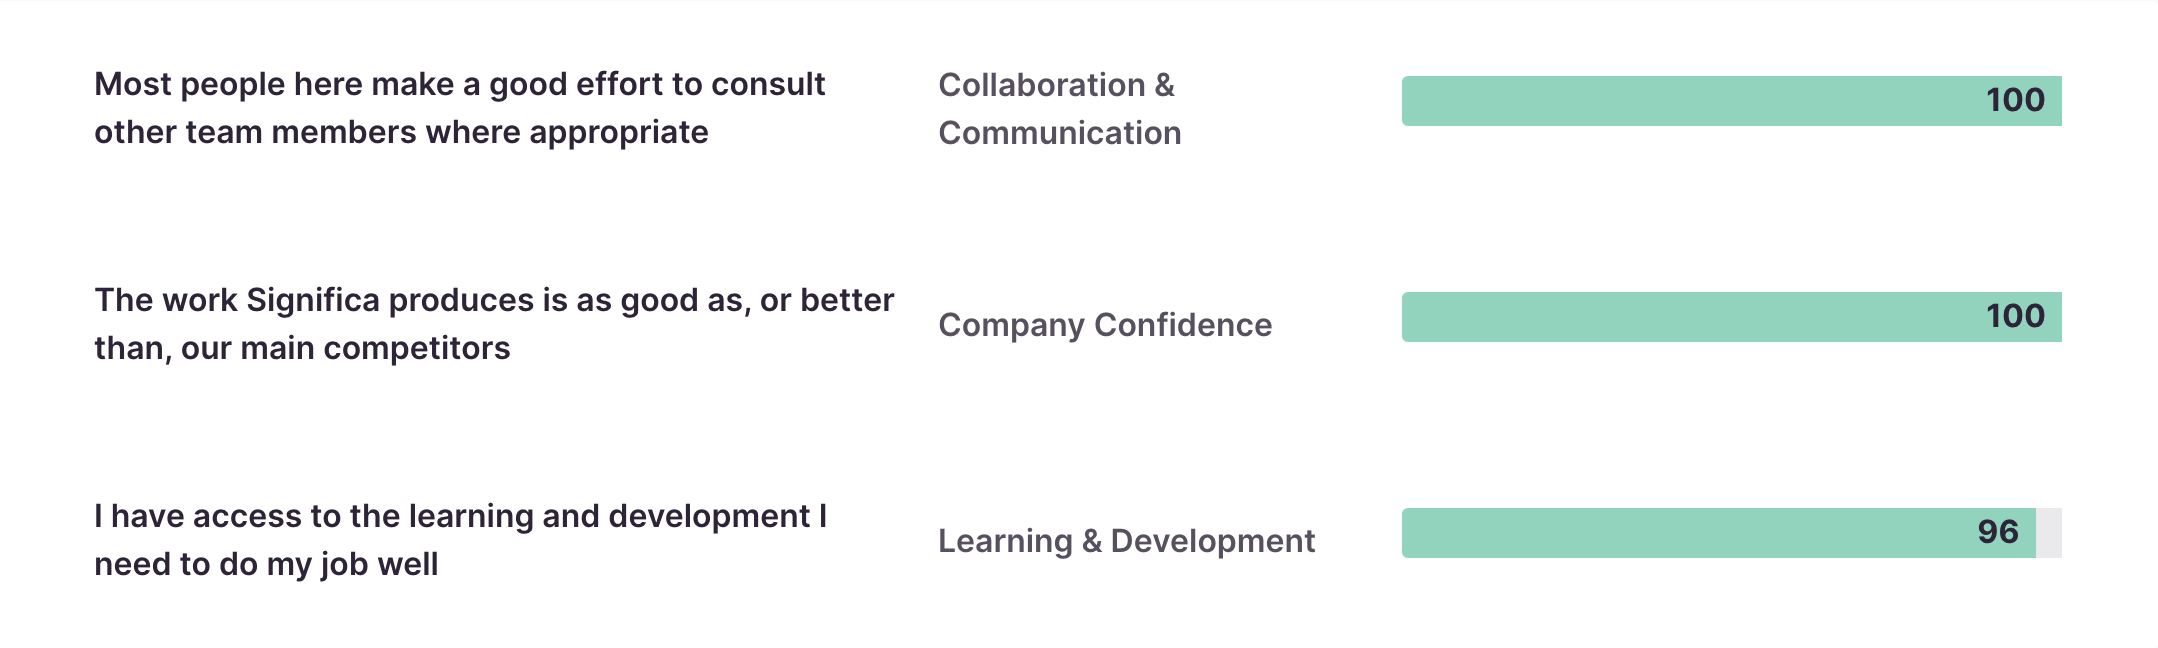
Best metrics.
As it says on the tin, these are our highest-scoring answers, which strongly impact the “Engagement” score.
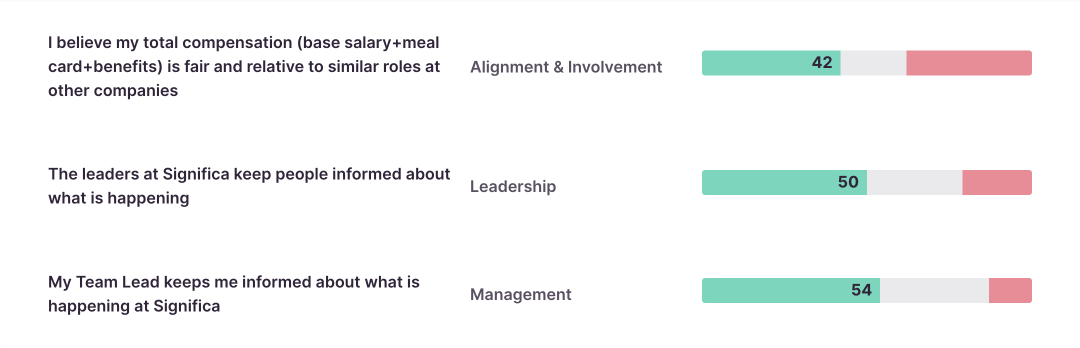
Top opportunities.
These relate to the lowest scoring areas required for improvement, with the highest potential to greatly impact the overall Engagement score.
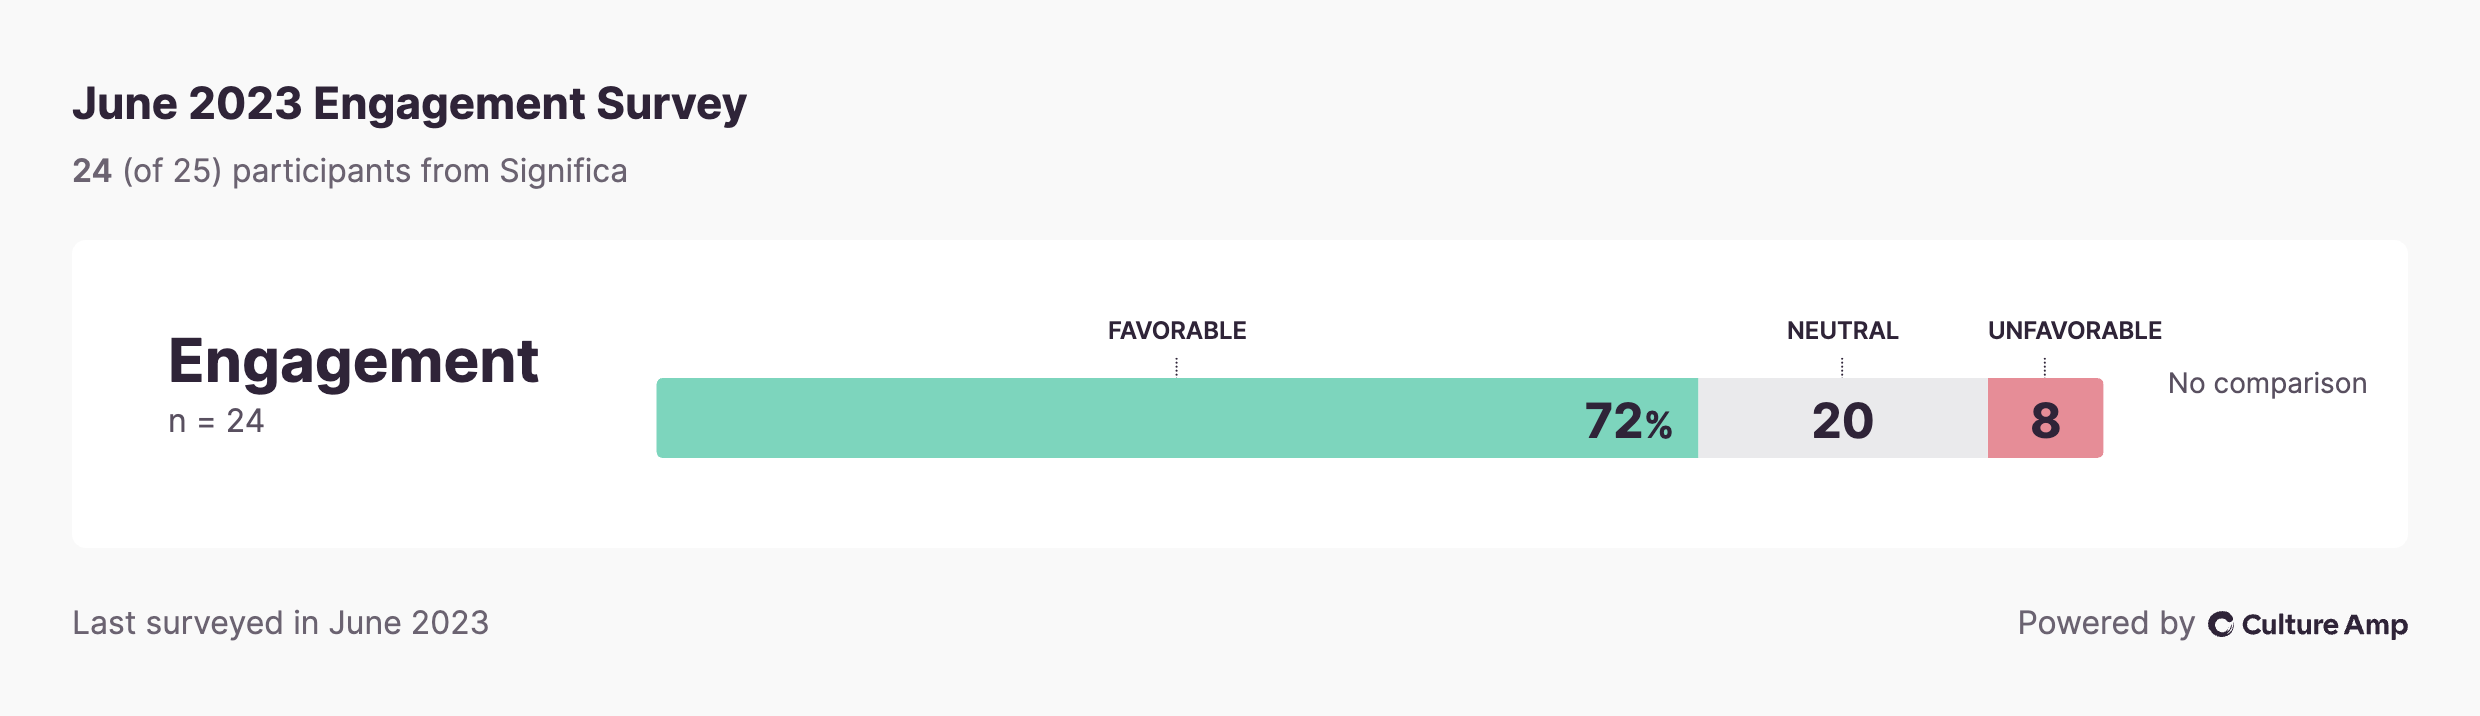
June 2023.
Our first ever Survey on CultureAmp. It laid the foundation for the Surveys to be.
Full report.
June ‘23: Engagement Survey Overview.pdf June_2023_All_questions_ .pdfEngagement score.
The Engagement score kick-started at 72%, topped with 8% of unfavourable voters and 20% neutral.
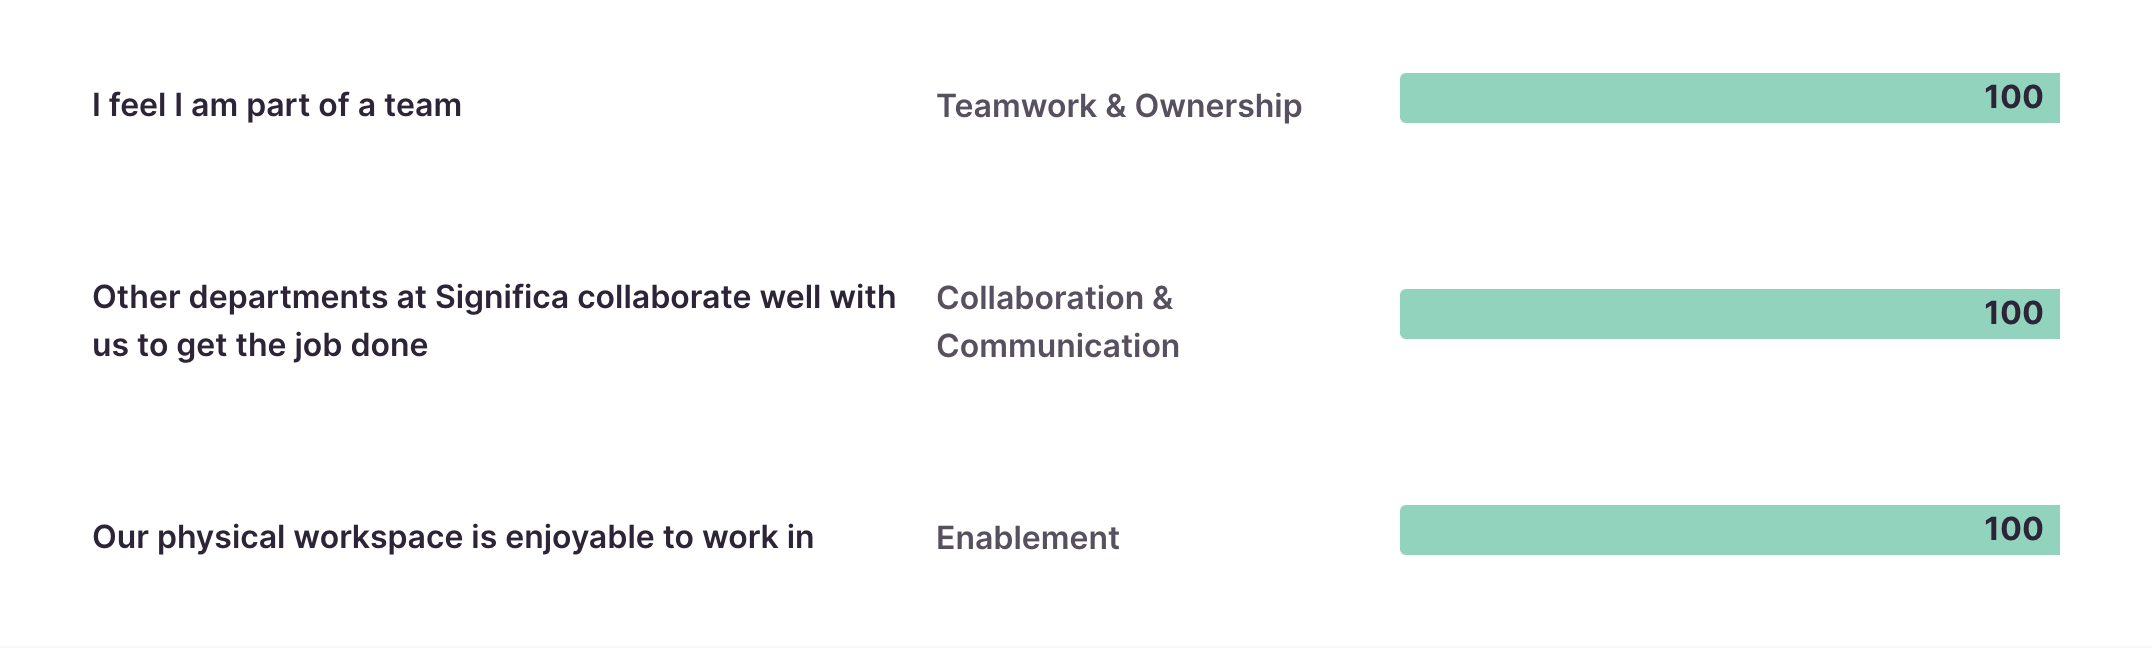
Best metrics.
These are the ones which our team voted more favourably.
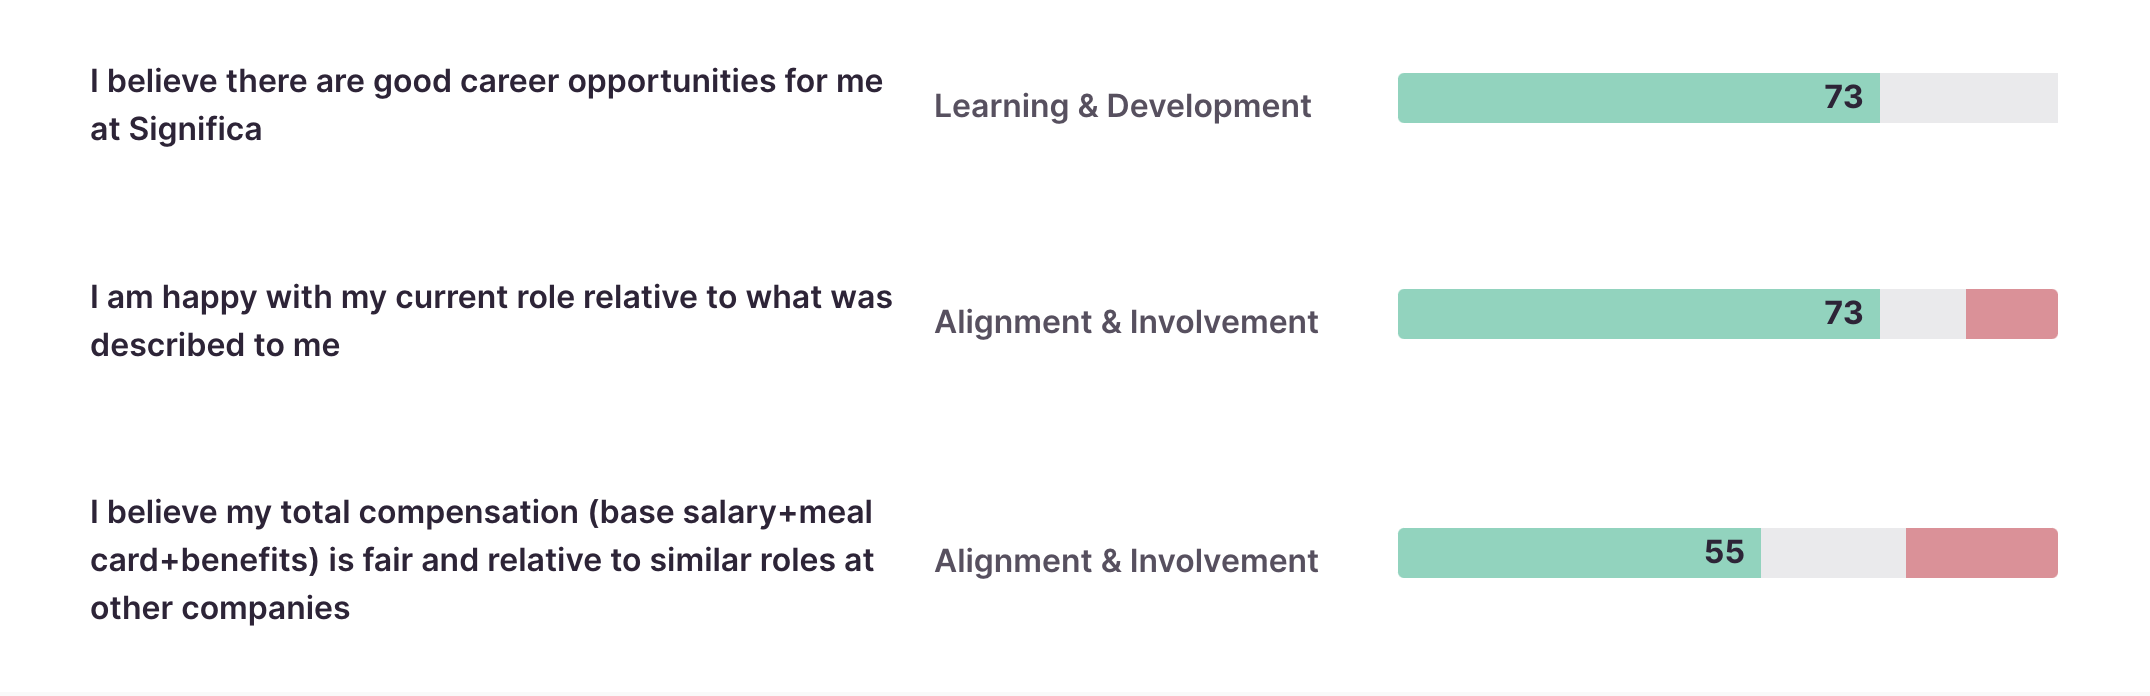
Top opportunities.
Those where we admittedly scored the lowest and therefore pose our best opportunities for improvement.